Tomorrow will be another DiverseNile Seminar! We will now focus on the First Millennium BCE in Kush. I am delighted that Kathryn Howley is going to talk about an exciting topic, “Performance and Appearance: Manipulations of Egyptian Style and Ritual at Amun Temples in Napatan Nubia.”
I have known Kathryn since many years and because I am currently in Luxor (for the Ankh-Hor Project and the South Asasif Conservation Project), I especially remember our encounter in one of the international conferences about “Thebes in the First Millennium BCE” held back in 2012 in Luxor. We share common interests since also Kathryn is particularly interested in questions of materiality and intercultural interaction.
Since 2018, Kathryn is the Lila Acheson Wallace Assistant Professor of Ancient Egyptian Art at the Institute of Fine Arts, New York University. I always enjoy discussing things with her and very much appreciate her stimulating application of theoretical frameworks drawn from both anthropology and art history on topics from Egypt and Sudan.
Kathryn is currently preparing her first book, The Royal Tombs of Nuri: interaction and material culture exchange between Kush and Egypt c. 650-580 BC – a study many of us are very much looking forward to. Her paper tomorrow will include ideas deriving from her current fieldwork project in Sudan at Taharqa’s temple at Sanam – without doubt much food for thought!
Do not miss Kathryn’s lecture tomorrow if you are interested in First Millennium BCE cultural diversity and interactions between Egypt and Sudan! As usual, late registration via email is still possible.
At the beginning of June, we have announced the launch of a new pilot study – as part of the WP 3 of the DiverseNile project – implementing and testing the potential of the Raman Spectroscopy technique on a selection of ceramic samples coming from our reference collection from the sites of Sai Island (SAV/S-samples) and Dukki Gel, Kerma (DG-samples).
This study is currently in progress as part of our cooperation with the Department of Earth and Environmental Sciences of the LMU, and namely with Fabian Dellefant, co-author of this post, who is a geoscientist and doctoral student under the supervisors of Prof. Dr. Trepmann and Prof. Dr. Gilder.
Due to fast measurements and its non-destructive approach with only little sample preparation, Raman spectroscopy can be easily applied to ancient ceramic materials, answering various technological questions, in particular on the manufacturing stages of production and firing of the pots.
For our investigation, we analysed so far a total number of 8 samples/thin sections (namely samples DG-18, DG-23, DG-29, DG-35, SAV/S 02, SAV/S 14, SAV/S 17, and SAV/S 51). Of all these, micro photos were primarily taken under the petrographic microscope with both transmitted and reflected light in order to select the areas of the sample to be examined with Raman Spectroscopy (normally two different spots including the clay matrix and particular organic components, both within the inner portion or core of the sample and on the rim area).
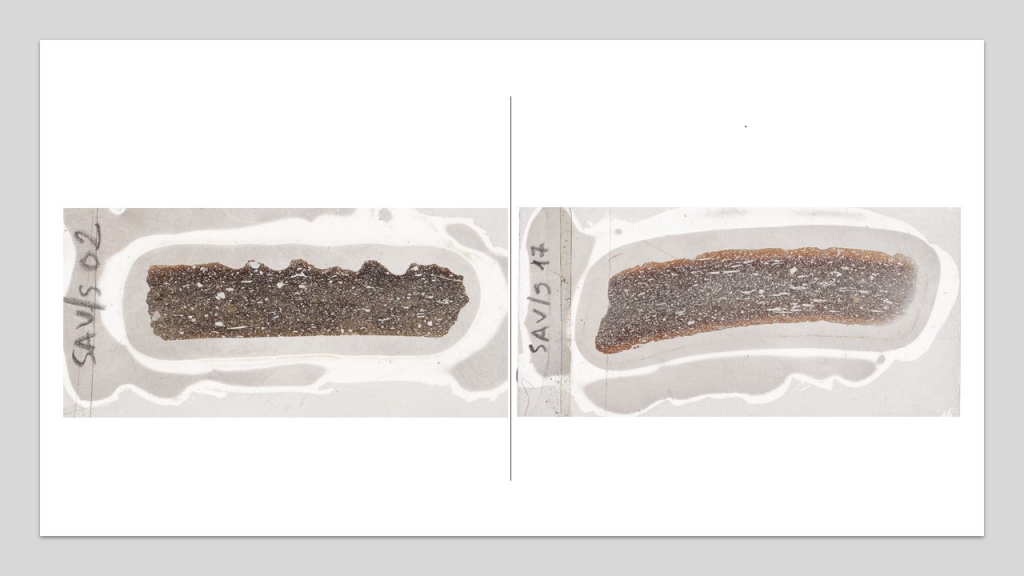
These samples are either locally produced cooking pots or other local ware manufactured both according to the so-called Nubian (DG-18, DG-23, DG-29, and SAV/S 02) and Egyptian style (DG-35, SAV/S 14, SAV/S 17, and SAV/S 51). All of them consist of a non-calcareous optically active clay matrix with dark cores and red or buff oxidised surfaces. In some specimens, the oxidised margins are narrow and well defined, while in others the red-black zonation appears larger and less regular. The Egyptian style samples normally show a kind of “sandwich” structure consisting of a dark core enclosed, both above and below, by red oxidised surfaces (Fig. 1).
Fig. 1 Photos of the fractures from thin section scanning of samples SAV/S 02 (left) and SAV/S 17 (right). Note the large amount of organic inclusions which have been totally or partially carbonized and are surrounded by voids. Both samples show a dark core due to insufficient penetration of oxygen during firing.
All these samples contain, in a different extent, organic matter either plant remains (chaff, straw, grass and possibly various cereals components), and probably herbivore manure (those finely divided straw particles). The organics are either totally or partially carbonized so that the plant inclusions are often preserved as black carbonized relics into the voids.
The carbonaceous core (dark-grey zone in the center of the ceramic samples) can be the result of insufficient firing under oxidizing conditions. It is also related to the use of a paste of high organic component. During the firing of the pot, the combustion of the organics acts indeed as a reducing agent, taking away oxygen from the firing environment (Velde and Druc 1999: 126-127, see also Quinn 2013).
In organic chemistry, the process of thermal decomposition, obtained by the application of heat and in the complete absence of an oxidizing agent is known as pyrolysis or graphitization.
Pyrolysis-GC/MS to ceramics which are conspicuously black or exhibit a black inner core from incomplete burn-out has been applied for the assessment of molecular properties of organic matter in archaeological pottery matrix (see Kaal et al. 2013).
In Raman Spectroscopy, vibrational modes of specific crystallographic components are used to determine a specific crystallographic structure. In our case, the temperature-dependent formation of graphite is used to quantify the highest temperature the sample has experienced.
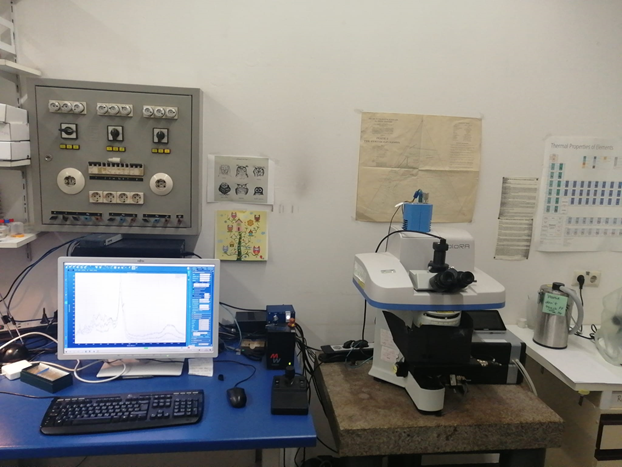
The lab setup consists of an optical microscope with different magnifications and a computer software, which handles data acquisition (Fig. 2). Measurements are conducted by using a laser with a 532 cm-1 wavelength directly on the thin section which has been first well-polished and cleaned with ethanol. In the lab, temperature is kept constant at 18° C degrees with the lights turned off so as not to interfere with the measurement.
Fig. 2 Lab of the Museum Mineralogia in Munich with the optical microscope (right) and the computer (left), which were used for the investigation.
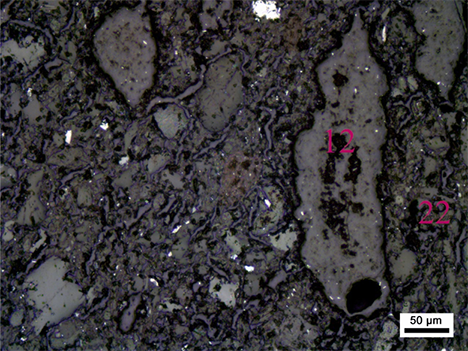
In the investigated ceramics, the precursor of the measured graphite can be either organic material, such as grass and straw, or dung of herbivores, which was mingled into the clay before heating. Furthermore, in some samples firing ash could have been added as well. Our preliminary results show that graphite can be clearly detected in the sample material. Interestingly, a group of samples showed graphite formation only within the organic components, which is interpreted as being the relicts from plant inclusions. Other samples clearly show graphite spectra also within the clay matrix, which could have been added to the clay as ash in the first place (see e.g., SAV/S 02, Fig. 3).
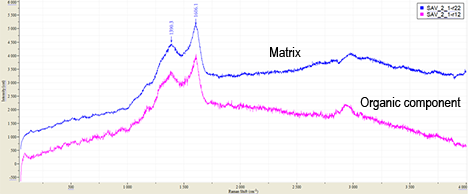
Fig. 3 Optical microphotograph with reflected light of sample SAV/S 02. Datapoint 12 (pink) marks an organic component in a void and refers to the Raman spectra SAV_2_1-r12 in Fig. 4. Datapoint 22 (blue) characterizes the ceramics matrix and refers to the Raman spectra SAV_2_1-r22 in Fig. 4.Fig. 4 Raman spectra of a datapoint from the matrix and an organic component. The spectrum of the matrix refers to datapoint 22 and the spectrum of the organic component refers to datapoint 12 of Fig. 3.
The interpretation of the maximum temperature the sample experienced is based on the ratio of two Raman peaks, which have a wavenumber of ~1390 cm-1 and 1606 cm-1. Given the dataset shown in Fig. 4, the maximum temperature can be estimated to ~600 °C after Guizani et al. 2017.
In the following weeks, we will proceed to the data processing and potential grouping based on the various Raman spectra collected from our pottery samples (we measured on average up to 20-25 datapoints for each sample). This will allow us to develop our preliminary interpretations and come to more specific conclusions on the quality of the organic material added to the paste and the heating temperatures reached during the firing. Eventually we might get insights on the type of clay sources selected to make the pots.
We can maybe spoil a bit things for you, anticipating that possibly some of the examined samples experienced a more homogeneous firing than others, these latter showing otherwise varying temperatures!
References
Guizani, C., Haddad, K., Limousy, L., and Jeguirim, M. 2017. New insights on the structural evolution of biomass char upon pyrolysis as revealed by the Raman spectroscopy and elemental analysis. Carbon 119:519–521. http://dx.doi.org/10.1016/j.carbon.2017.04.078.
Kaal, J., Lantes-Suárez, O., Martínez Cortizas, A., Prieto, B., and Prieto Martínez, M. P. 2013. How Useful is Pyrolysis-GC/MS for the Assessment of Molecular Properties of Organic Matter in Archaeological Pottery Matrix? An Exploratory Case Study from North-West Spain. Archaeometry 56 (S1): 187–207. https://doi.org/10.1111/arcm.12057.
Quinn, Patrick S. 2013 Ceramic Petrography. The Interpretation of Archaeological Pottery and Related Artefacts in Thin Section, Oxford.
Velde, Bruce and Druc, Isabelle C. 1999. Archaeological Ceramic Material. Origin and Utilization, Berlin.