Before we’re able to go to the field, a lot of work on the cemeteries in our concession area is currently underway from Munich. Marion’s recent blog posts already discussed the potential of magnetometry for us to better understand what we are dealing with, and this is especially true in connection with Cajetan’s remote sensing work. Cajetan’s work has been revealing some interesting aspects of our sites and hopefully you’ll be able to catch glimpses of his work soon in here.
This work provides important background regarding the specificities of our sites. Alongside an assessment of the cemeteries and comparison with other sites across Nubia, this allows us to put together an ‚ideal type‘ (sensu Max Weber) that can guide us through future survey and excavation. The data sets produced by Vila, as well as previous MUAFS seasons, are also crucial for us to establish this ideal type, which works as a methodological tool to confirm our hypotheses (or not).
In my previous posts, I’ve already shared details about the assessment of sites I’ve been carrying out over the past months. Base on Vila’s data, we can know what to expect from the cemeteries in terms of preservation, types of structures etc. For example, the Late New Kingdom „tomb of Isis“ works an example of „elite“ or „sub-elite“ burial ground in the periphery of temple towns, where Egyptian and Nubian features mixed, probably to a greater extent than at temple towns—an example of hypothesis that we can create departing from an ideal type. This mixture occurred, for instance, in the combination of Egyptian substructures and a tumuli superstructure, remains of which were located in previous MUAFS seasons (see my previous posts). Departing from an ideal type such as the „tomb of Isis“ we can approach how the ideal varies across geographical and social spaces within our concession area.
For example, Marion and Cajetan’s work are shedding light on the extension of cemeteries where we can easily see from above those tumuli, some of which already explored by Vila, but also other features. It is difficult to determine from a distance what is the nature of this evidence. Comparative research then comes in handy. I’ve already proposed a discussion on the whereabouts of the majority of the Nubian population during the New Kingdom (a discussion that also applies to the Kerma period).
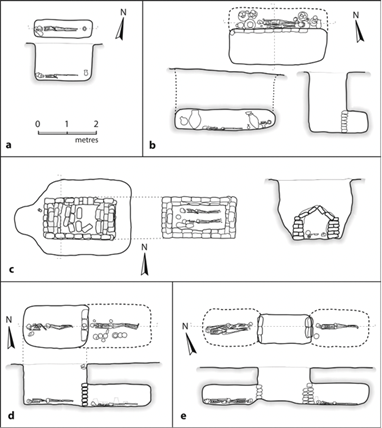
Figure 1: tomb types at Fadrus, adapted from Spence 2019, based on Säve-Söderbergh and Troy 1991.
Other Nubian cemeteries such as Fadrus in Lower Nubia add information about non-elite groups to our ideal type (figure 1). If larger tumuli such as the „tomb of Isis“ are easily located based on drone and satellite imagery, simple non-elite pit graves originally with no extensive superstructures pose more challenges. Though, comparisons allow us to open up to possibilities that include, in our research framework, social groups not clearly represented by evidence accumulated from large temple-town cemeteries. These groups—which comprised the bulk of Nubian populations working in the fields, mines, and probably carrying out other work in the service of larger centres—are yet to be fully understood (and here work at the cemeteries of Amarna provide us interesting comparison points, see Stevens 2018).
Several are the challenges of doing research from the office, as we cannot yet go to the field. But work conducted so far, from various fronts, help us establish a pretty solid starting point from which to explore our sites knowing more or less what to expect. This takes into account old and new evidence, extensive comparisons with other sites and a clear theoretical framework, which is essential to formulate research questions and carry out large scale projects such as DiverseNile.
References
Säve-Söderbergh and Troy 1991. New Kingdom pharaonic sites: the finds and the sites.
Spence 2019. New Kingdom burials in Lower and Upper Nubia. In Handbook of Ancient Nubia, ed. D. Raue.
Stevens 2018. Death and the city: The cemeteries of Amarna in their urban context. Cambridge Archaeological Journal 28 (1): 103–126. doi:10.1017/S0959774317000592
As the new student assistant of the DiverseNile Project, I am happy to give in my first blog post an overview and summary about the experimental archaeology days at the MAMUZ Museum in Asparn/Zaya and of course about our experiments with the fire dogs, dung fires and pottery making.
Over the course of four days many archaeologists, experts and students came together in Asparn to work on several different experiments, share ideas, discuss questions and, of course, creating the possibility to experience archaeology in a practical and exciting way. Being outside in the nature, doing practical tasks and having a slight glimpse into how life was in the past was especially refreshing for everyone who had (and still has) to sit daily in front of a computer screen to follow online lectures.
I’ll start with a short summary about the event itself before I’ll describe our experiments.
In the big garden that belongs to the MAMUZ Museum, which is worth a visit and currently showcases an exhibition about experimental archaeology, are several reconstructed buildings and structures that showcase the history of humans in that area. Starting from tents of the palaeolithic times and ending at the current experimental construction of a medieval church. Inside and next to these buildings all different kinds of experiments were conducted, and certain techniques showcased, all part of a class of the University of Vienna where we could participate as guests from Munich. Experts showed how stones were chipped during the Stone Age and what materials were used for that, another explained how bones and horns were carved into tools and accessories, pottery was being made, as well as weaving, cooking a pig for a whole day in a pit and Ritschert (a stew the people who worked inside the Hallstatt mine ate everyday), iron and bronze smelting, creating jewellery and much more. One experiment I found extremely fascinating was the cremation of a pig on a pyre to figure out more about human burials of the European Bronze Age. The pig (which died naturally of an old age and not explicitly for this experiment!) was even dressed up and got ritual offerings for its descend into the fire and therefore afterlife, whatever that might have looked like for the people of the Bronze Age. Watching this, I can really imagine how special and touching such a burial practice was for these people, watching a loved one being consumed by the flames over several hours in such a way seems bizarre from our current, modern perspective of life and death. Recapitulating I can really recommend the experimental archaeology days in Asparn. It was an incredible insight into life with its problems in the past and amazing that everyone showed you their skills and techniques while letting you try them out as well.
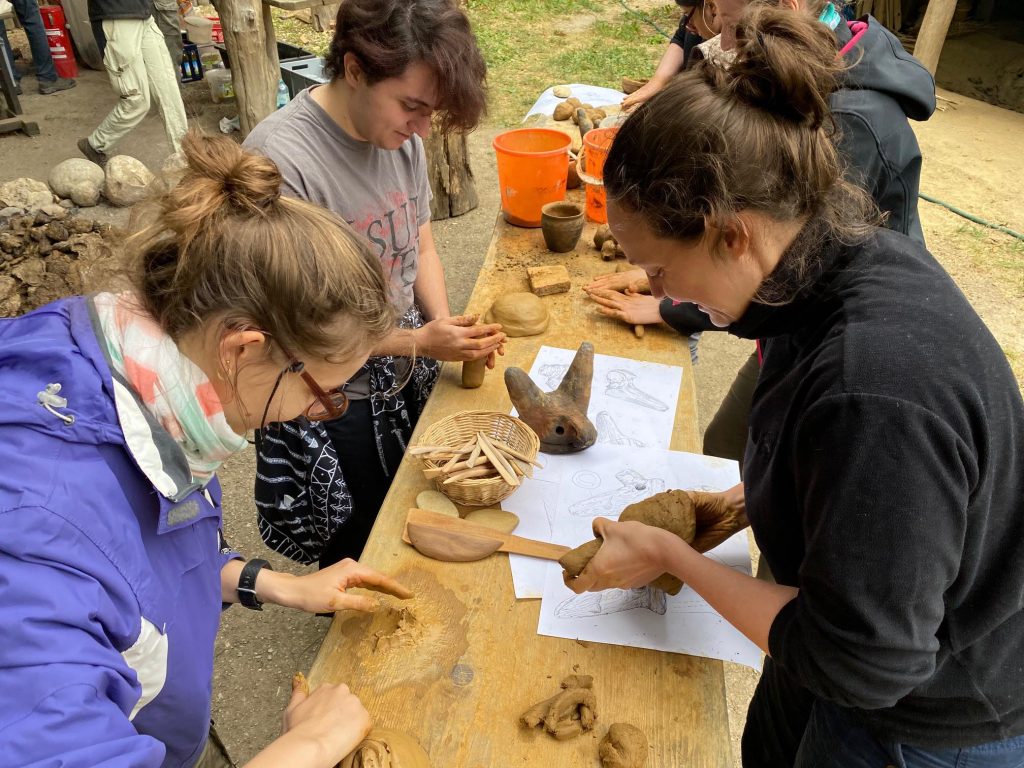
Now to our experiments: first we focused to let every participant get a feeling for the material clay while recreating Nubian figurines depicting female idols and animals. After everyone had fun creating figurines and got familiar with the material, we went one step back and created our own usable clay. Therefore, we learned what processes were necessary to get a formable material out of dry earth clumps. One part of our group was busy preparing the dry dung, in this case goat and horse dung, so it can be used to temper the clay. With that we created two types of different clay, one with the horse dung and the other with the goat dung.
The next task was important: recreating new fire dogs (based on the original drawings of the fire dogs from Sai Island and existing replicas made years ago within the AcrossBorders project) with the two different clay types which can be used for upcoming experiments. For all of us, who didn’t use pottery since elementary school, this was quite the big challenge to create them in the right proportions and dealing with the problems if parts breaking off or how to close cracks again. But in my opinion, everyone did a great job and we now have plenty of fire dogs that will hopefully survive a lot of future experiments!
Producing a new set of fire dogs. Photo: J. Budka.
While our figurines, fire dogs and test vessels were drying to be ready for burning, we started to figure out how the different dung types we had available behaved when trying to make a fire out of them. For our first small experiments that way, we split up in two groups where each group had to use camel and horse dung and, in the end, compare the results. For our first attempts the results were not really convincing: in both groups it took us a long time to start a fire with the camel dung, it produced a lot of (not so pleasant) smoke, the flames didn’t last long only with constant blowing into the fire, but when it worked we reached around 500°C. The horse dung was a little bit better, but it was still hard to get to a flame. The two experiments got inconclusive results with the highest temperatures varying in between 300°C and 660°C. Though there are many reasons why our fires didn’t work the way we hoped, first we had to figure out how we organise the experiments on our own and with try and error we found better ways to observe our fires for the next tasks. Also, the quantity of the dung we used had a big impact on how the fires behaved, small amounts burned down way to quickly, and the windy weather wasn’t great for the flames either. But when experiments don’t work out the way you anticipate you learn a lot more and can change parameters for the coming ones.
Meanwhile, our PI Julia Budka conducted, together with a group of colleagues, the firing of pottery using cow dung as fuel. Surprisingly that fire reached over 1000°C, an incredible heat for such a simple fire. Whereas we found that exciting, the pottery didn’t, and a few were damaged in that heat. But this surprising result needed a follow up experiment, checking whether these high temperatures can be replicated. Therefore we created two small fires, like in our previous experiments, with two different cow dungs to see which temperatures we could reach. We quickly realized that small fires didn’t reach those high temperatures and were only around 500°C and behaved like horse and camel dung previously. Therefore, we decided to create a bigger fire, which worked surprisingly better! We quickly reached the same temperatures in the small experiment and surpassed them in a short amount of time. While blowing into the fire with three persons in a row, we successfully reached over 1000°C in a few minutes and this in a smaller fire, compared to the one where the pottery was burned. This opens a possibility for different future experiments!
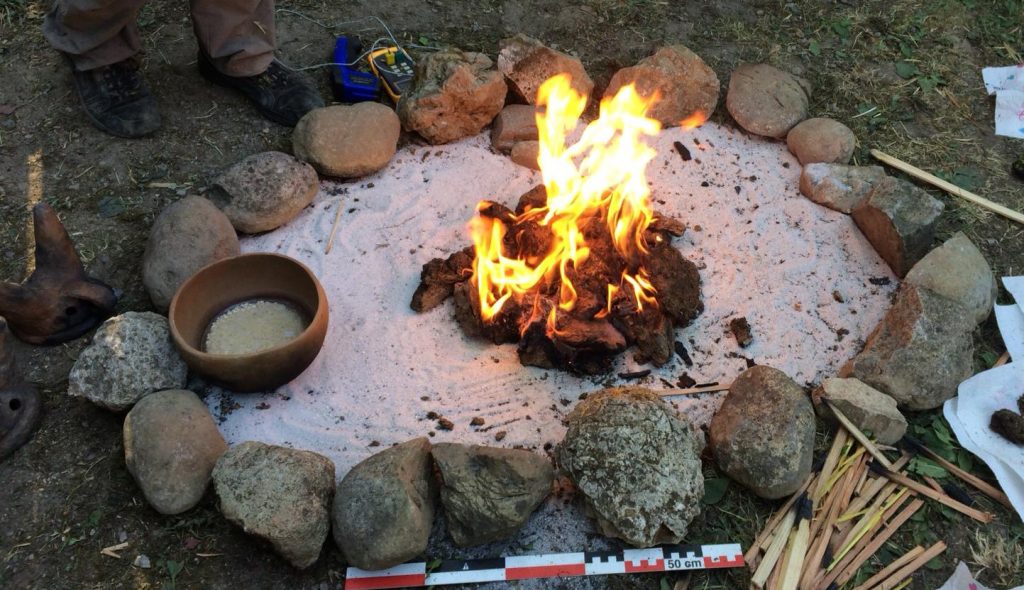
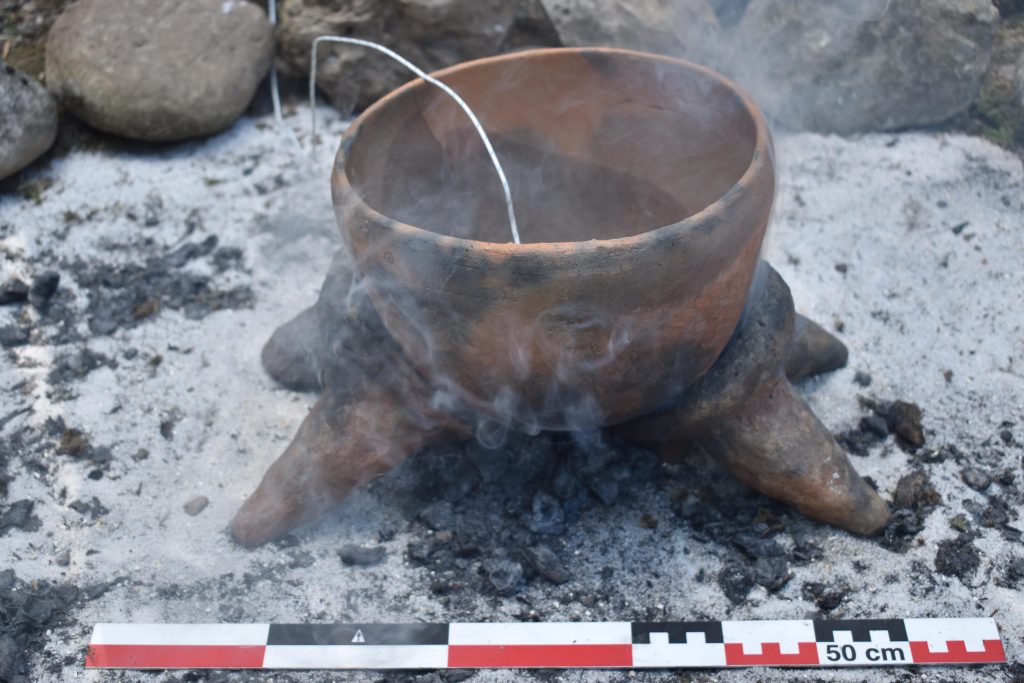
The dung fire used for cooking with a set of firedogs and a Nubian cooking pot. Photo: S. Neumann.
As our last experiments we used two firedogs and one cooking pot to figure out if such a setup is useful for cooking. We started a fire with horse dung in the middle between the two firedogs, above it we placed the pot, so it sat on the two firedogs. For a while it worked pretty well, but as the dung created more and more ash the space was not big enough that the fire could get enough oxygen to burn and be sustained with new dung properly. It was a long and tedious process to cook something this way. Also, the term cooking is misleading, we just barely managed to heat the water inside the pot a little bit.
A trial arrangment of two fire dogs holding a cooking pot above the dung fire. Photo: S. Neumann.
Since this experiment didn’t work well, we decided to change our methods and tried a big fire with cow dung again. We spread out the dung on a bigger area, created a well working fire and placed the firedogs and the pot in the centre of it. The fire was burning and reached a temperature of around 470°C, but surprisingly the contents in our pot only measured around 60°C. Where did all the heat go? Was the pot absorbing all the heat or the firedogs? In the end the firedogs suffered quite a bit in this fire, they ended up turning completely black – nothing which is known from the real archaeological findings.
With that our experiments in Asparn ended with a lot more questions and we still have no definitive answer how the firedogs were used exactly. Let’s hope we can continue our experiments next year with the new knowledge and questions we gained this time!
In my latest blog post, I discussed how to read magnetograms and what we have to keep in mind regarding the Earth’s Magnetic Field and the location of the concerning site. Another important factor to approach the comprehensive interpretation of our data is the environment, esp. the geology, geomorphology and formation processes of the region. For magnetometry, it is especially the knowledge about magnetic properties (ferromagnetism) of rocks, minerals and soils.
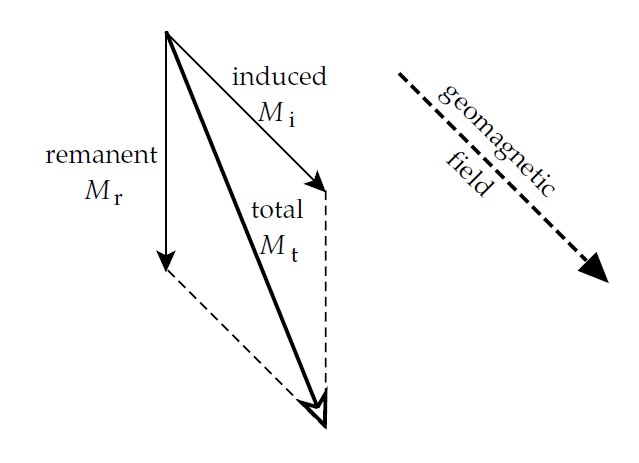
The magnetogram shows the total magnetization, which is composed by the induced and the remanent magnetization (Fig. 1). The relation of induced and remanent magnetization is described by the Koenigsberger ratio (Q-ratio). It informs us not only about the quality of the rock sample for paleomagnetism, but also if we are dealing with archaeological objects.
Figure 1: Magnetization for rocks with induced and remanent amounts (Lowrie 2007, 321 fig. 5.40 a).
The induced magnetization exists with an applied external field only, e.g. the Earth’s Magnetic Field, and mostly goes along with the direction of the Earth’s Magnetic Field. For interpreting our magnetograms, it is helpful to conduct additional magnetic susceptibility measurements in the field, which tells us more about the induced magnetization. The magnetic susceptibility describes how magnetizable a sample/material is in an applied field. It is affected by the type of contained minerals as well as their grain size. The resulting values are unit less and can be negative (diamagnetic) or positive (ferromagnetic, ferrimagnetic, paramagnetic). Susceptibility can be measured in the field as well as in the laboratory, where more precise measurements are possible and additional parameter can be investigated.
The remanent magnetization is a permanent magnetization, independent of an external field, and important in paleomagnetism and archaeomagnetism. The natural remanent magnetization is the sum of the remanent magnetization and can be composed by several elements. For archaeological prospection, one of the most important remanent magnetizations is the thermoremanent magnetization (TRM). It is formed through heating of material over Curie temperature and cooling in an applied magnetic field, whose direction (Declination) is saved. Kilns, ovens and burnt objects like pottery or bricks etc. are the best examples for TRM. Chemical remanent magnetization (CRM) can be found in sedimentary or metamorphic rocks, whereas detrital remanent magnetization (DRM) develops during sedimentation of small magnetic particles in smooth water. Isothermal remanence (IRM) is the reason why we can detect also lightning strikes (LIRM) in our magnetograms. Although remanent magnetization is usually permanent, several factors could alter it, such as weathering.
But why are some materials/rocks more magnetic or magnetizable than others? It depends on iron oxides. Iron oxides are not only responsible for magnetization but also playing a role which colour a material has. The most important iron oxides regarding archaeological purposes are magnetite, maghemite, greigite, hematite, goethite as well as titanomagnetites, occurring in soils. While magnetite and maghemite are showing up to 1000 times higher susceptibilities than hematite, the latter is responsible for the typical red colour. Pedogenic, anthropogenic, lithogenic, and bacterial processes are responsible for the enhancement of soils, esp. top soils. Additionally, originally nonmagnetic materials can show enhanced magnetization: magnetotactic bacteria in organic materials are generating magnetite so that already gone posts, palisades etc. can be detected by magnetometry.
Magnetic susceptibility measurements in the field can be carried out selective e.g. for scattered objects and rocks on the surface or areal (separate geophysical prospection method). They can be used to define the extension of archaeological sites, activity zones or features in human made environments. Furthermore, they help understanding the morphology, formation processes, erosion and sedimentation as well as stratigraphic sequences for climate research and soil formation processes. Usually, top soils as well as archaeological soils are showing higher magnetic susceptibility values caused by enhancement of magnetic minerals due to the use of fire and fermentation. That is the reason why we can detect areas of human activity, e.g. settlements, and determine their extension.
How can we transfer this knowledge to the MUAFS concession area? The geological map of the Nile valley shows mostly sandstones, siltstones and mudstones accompanied by metavolcanic rocks as well as colluvium, sand sheets and dunes. For the volcanic rocks, we can assume high magnetic susceptibilities, whereas for the sandstones, siltstones and mudstones weak magnetic susceptibility is rather likely, depending on the contained minerals.
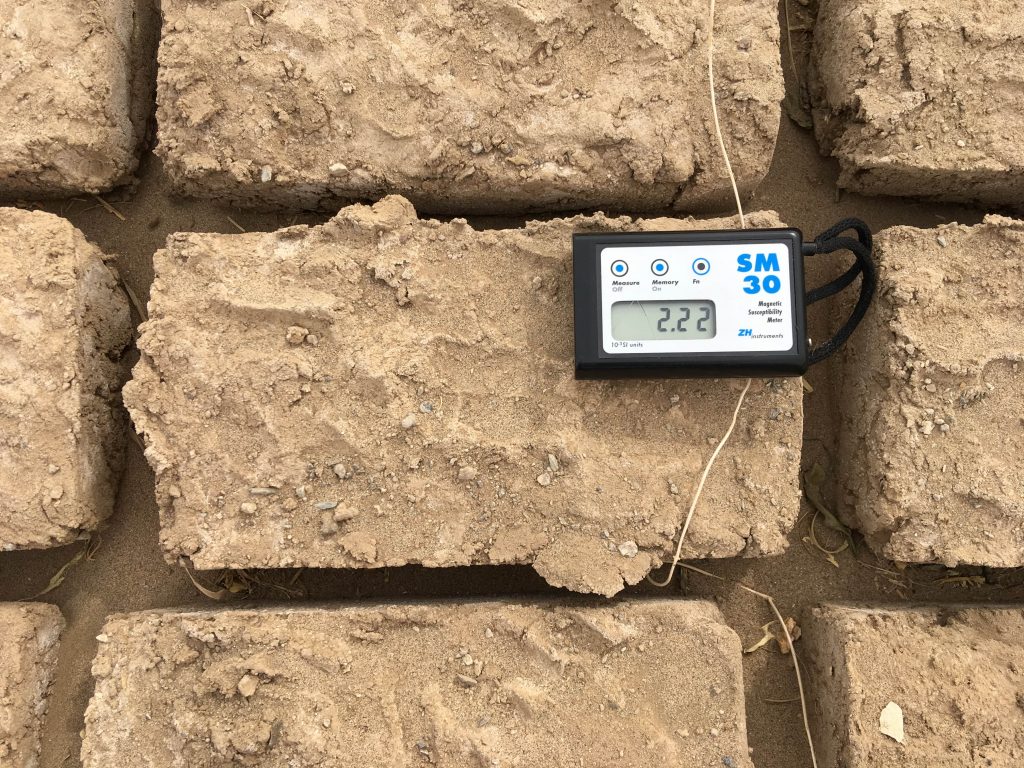
During the first geophysical campaign, we conducted spotty magnetic susceptibility measurements on our sites as well as the environment. Therefore, we used the handheld Kappameter SM-30 (Zh-instruments, Fig. 2). While magnetometry is a passive method, magnetic susceptibility meter are active instruments with a small coil included. Sampling the scattered rocks and archaeological objects like mudbricks gives an idea what we can expect in the magnetogram. Furthermore, the method can be applied in excavation trenches e.g. to distinguish stratigraphic layers or walls/floors and susceptibility maps can be produced. Due to magnetic susceptibility it is feasible to differentiate sources of raw material e.g. for mudbricks.
Figure 2: Measuring the magnetic volume susceptibility of a mudbrick laid out in the sun for drying with the Kappameter SM-30, showing a value of 2.22 [10-3 SI] (M. Scheiblecker).
For the settlement site GiE 001 at Ginis East, the scattered rock material shows mostly susceptibility values in a range of 0,302 to 0,826 [10-3 SI], esp. quartz, schist, and sedimentary rocks, while rocks of volcanic origin result in values around 7,5 [10-3 SI]. The surface values are ranging between 4,35 to 5,6 [10-3 SI] and mudbrick from a partly upright standing hut shows values of around 4 [10-3 SI]. For this site, we could expect therefore the following: walls made of sedimentary rocks would cause negative anomalies in the magnetogram, while the use of volcanic rock would result in positive anomalies. Mudbrick or galus walls (of stamped mud) are more difficult to predict; depending on their mineral composition, they are revealing positive or negative anomalies. Fire installations or the use of fired bricks would be easily recognizable because of their high values.
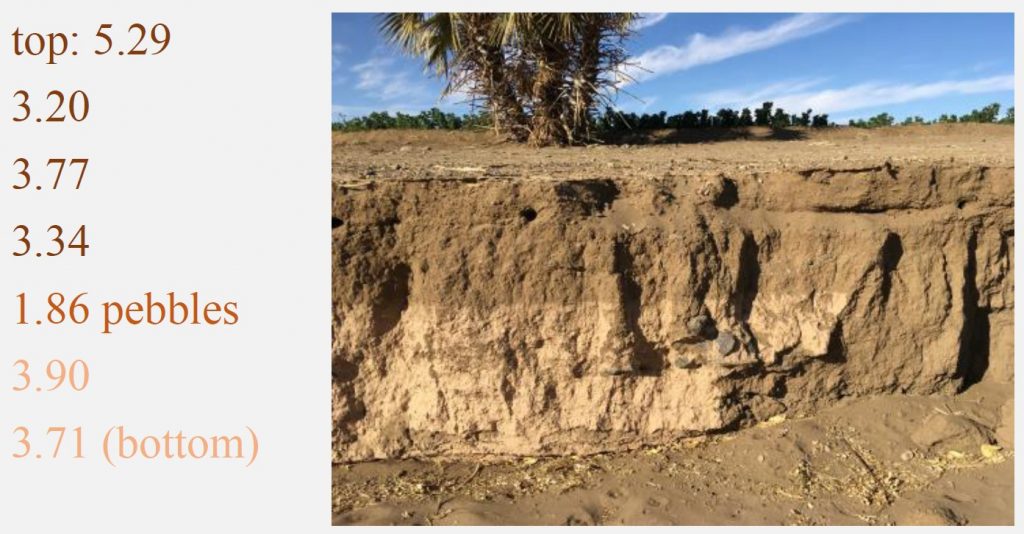
A profile along a street close to the Nile River shows the different sedimentation layers very nicely: different colours as well as susceptibility values can be seen in Figure 3.
Figure 3: Magnetic susceptibility values (in 10-3 SI) of a profile next to the Nile (M. Scheiblecker).
This example shows the complexity of magnetic susceptibility in combination with colours; darker and brighter layers show similar values, whereas the surface reaches the highest value. The layer with pebbles reveals the lowest value due to the included pebbles of probably sedimentary origin. For understanding the environment of archaeological sites and their formation processes, it is important to consider not only the survey, excavation and magnetometry results itself. Furthermore, knowledge in geology, geomorphology as well as the investigation of their parameters add details for a comprehensive picture of an archaeological landscape.
At the end, if you are asking yourself how magnetizable you are: without any ferromagnetic items from your clothes or e.g. glasses, the magnetic susceptibility would be almost zero or even negative, as the human body consists mostly of water.
References
Aspinall, A.; Gaffney, C.F.; Schmidt, A. (2008): Magnetometry for Archaeologists. Geophysical methods for archaeology 2. Lanham: AltaMira Press.
Butler, R.F. (1998): Paleomagnetism: Magnetic Domains to Geologic Terranes: Electronic Edition. Boston: Blackwell.
Dalan, R. (2017): Susceptiblity. In: Allan S. Gilbert, Paul Goldberg, Vance T. Holliday, Rolfe D. Mandel and Robert Siegmund Sternberg (eds.): Encyclopedia of Geoarchaeology. Dordrecht: Springer Reference (Encyclopedia of Earth Sciences Series), 939–944.
Fassbinder, J.W.E.; Stanjek, H.; Vali, H. (1990): Occurrence of Magnetic Bacteria in Soil. Nature 343 (6254), 161–163.
Fassbinder, Jörg W. E. (2017): Magnetometry for Archaeology. In: Allan S. Gilbert, Paul Goldberg, Vance T. Holliday, Rolfe D. Mandel and Robert Siegmund Sternberg (eds.): Encyclopedia of Geoarchaeology. Dordrecht: Springer Reference (Encyclopedia of Earth Sciences Series), 499–514.
Lowrie, W. (2007): Fundamentals of Geophysics, Cambridge: Cambridge University Press.
The magnetic data collected at our first campaign in the Attab to Ferka region in 2018/2019 was first processed and interpreted directly after the field season. After the first excavation campaign in 2020, focusing on two of the four geophysically investigated sites, a reconsideration of the data took place. It is based on the excavation results, the photogrammetric data and new kite images.
But before looking at the data, you have to know where exactly on earth the data was generated! The Earth’s magnetic field is a complex system, which is protecting us against ultraviolet radiation, as it is deflecting most of the solar wind, which is stripping away the ozone layer. The earth’s magnetic field can be visualized as a three-dimensional vector: Declination (angle in ° to geographic north, X), Inclination (horizontal angle in ° or magnetic dip, Y) and Intensity (measured in T “Tesla” resp. nT “Nanotesla”, Z). In archaeomagnetism, all components are measured to be compared to the single curves of the region. For magnetometry and interpreting these data, the Inclination is the most important value besides the Declination, which helps for example to detect in situ burnt features. The Inclination describes the angle in which the Earth’s Magnetic Field meets the surface of the Earth itself. Therefore, the angle is changing depending on your position e. g. if you are closer to the magnetic poles or to the magnetic equator.
The geomagnetic field changes all the time, every second, every day, and every year! For Munich resp. Fürstenfeldbruck you can follow the alterations simultaneously here. The geomagnetic observatory there is part of the Ludwig-Maximilians-Universität and the Department of Earth and Environmental Studies. As you may know, the magnetic poles are wandering as well. The magnetic north pole did it that fast in the last years that the navigation map had to be changed before the standard interval of five years in 2019. This world magnetic model (WMM) is available online.
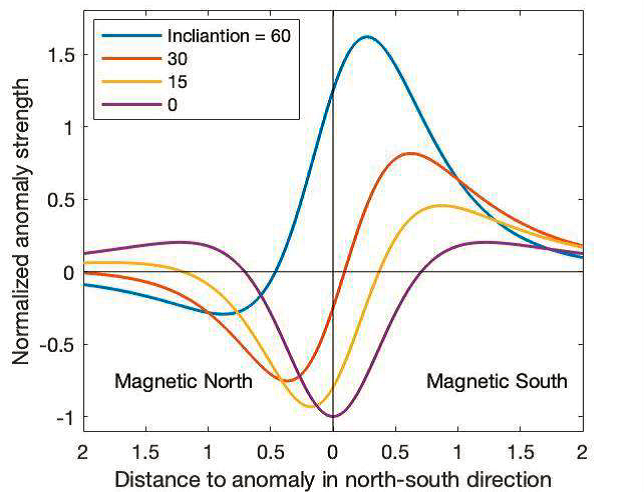
But why do we have to know especially the Inclination of the area we are working in and doing magnetometry? The shape and intensity of every single anomaly is depending especially on the Inclination! The shallower the Inclination the wider the anomaly is visible in the magnetogram. Additionally, the dipole (positive/black – negative/white) components are changing. The closer we are measuring to the geomagnetic equator (not the geographic equator), the larger gets the negative part of the anomaly and the lower are the amplitudes of the magnetic signal. Figure 1 illustrates the differences in Inclination for a single anomaly.
Figure 1: Anomaly strength of the total field intensity as north-south traverse through the anomaly’s centre for different Inclinations (Ostner et al. 2019, 181 Fig. 2).
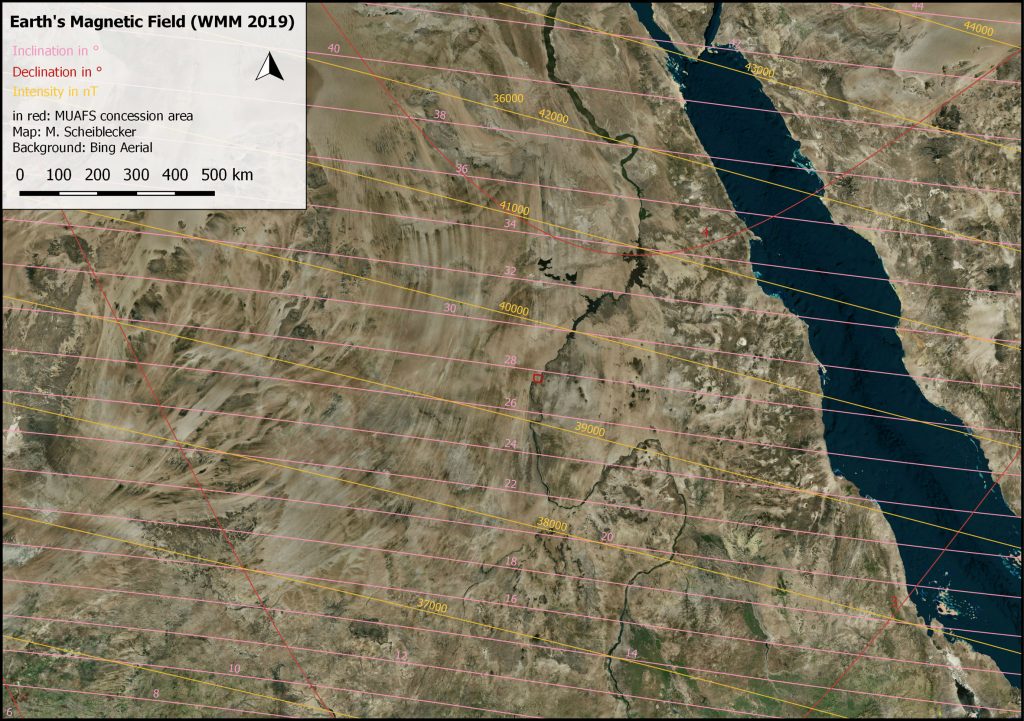
While the Inclination in Munich is around 64°, the Inclination in the MUAFS concession area is 27-28° and shallower. The components of the Earth’s Magnetic Field at the MUAFS concession area are illustrated in Figure 2, showing a Declination of almost 4° and a total field intensity of around 39.000 nT (Munich: 48.585 nT). The measured archaeological and geological features, visible in the magnetogram, are showing contrasts of sometimes less than 1 nT. Due to different Inclinations, the same archaeological feature would result in a different anomaly in Sudan compared to Munich. While the anomaly in Sudan would be wider (see the red curve, Fig. 1) than in Munich (ca. the blue curve, Fig. 1), it would cause lower intensities as well as showing more negative parts than the Munich one. This means while in Bavaria the negative part of an anomaly is regarded more as a small “white shadow”, in Sudan it would be almost equal to the positive part of the anomaly. Furthermore, depending on the depth of the buried feature, the shift in locating the feature could be larger with shallower inclination.
Figure 2: The Earth’s Magnetic Field in Sudan after World Magnetic Model (WMM) 2019, with the MUAFS concession area in red (M. Scheiblecker).
Regarding the used magnetometer – a gradiometer, the intensities are additionally lower than for example with a total field magnetometer, which makes it more difficult to interpret the data and why sometimes low value-features like pisé walls are not detectable with gradiometers. Furthermore, with wider anomalies closer to the geomagnetic equator like in Sudan, it is more possible that anomalies are overlapping so that it is not easy to distinguish features lying next to each other or from different periods.
Usually, magnetograms are shown in greyscale to avoid confusion and “pseudo-limitations” of different values and colors. For interpreting the data, one can play around with the minimum and maximum values as well as inverting of the greyscale version. On magnetograms of measurements with the total field magnetometer usually a high-pass filter is applied, which can be overlayed with the total field data as well.
In rare cases it is helpful to use color scales for the magnetograms additionally to show special features better or to highlight some very high or low values. If the magnetogram is disturbed by high magnetic anomalies like metal fences, iron rubbish on the site etc., color scales are not useful anymore, because they are showing especially the disturbances due to their high amplitudes and less of the archaeological features itself. Nevertheless, it is possible to adjust the color scale as needed for every site separately.
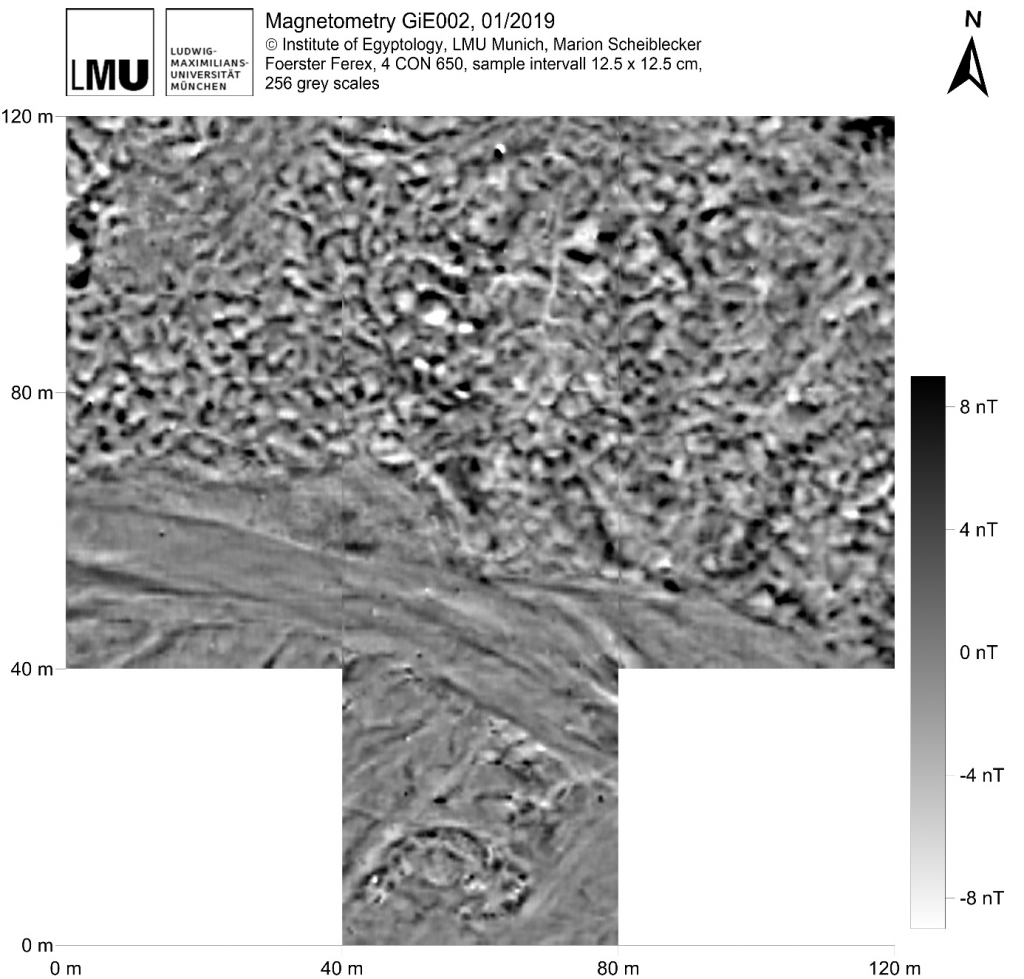
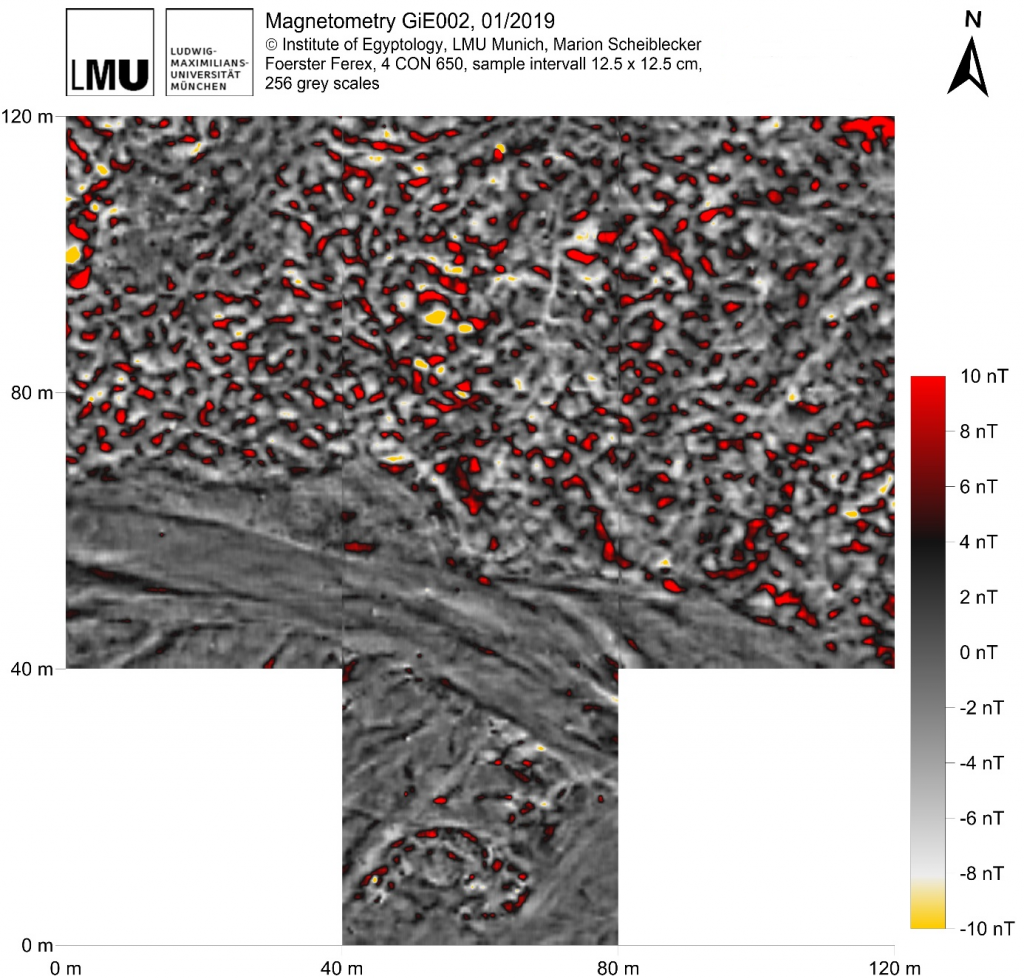
Illustrating the mentioned methods, I would like to show the magnetogram of GiE 002, where a cemetery is located.
Figure 3: Magnetogram of GiE 002 in greyscale (M. Scheiblecker).
The usual greyscale (Fig. 3) shows clearly the traces of the recent and former wadi/khor, tumuli-like features in the very south as well as lots of features of different shape in the northern part of the magnetogram, interpreted as graves. They are resulting in positive anomalies, accompanied by negative anomalies of different amplitudes.
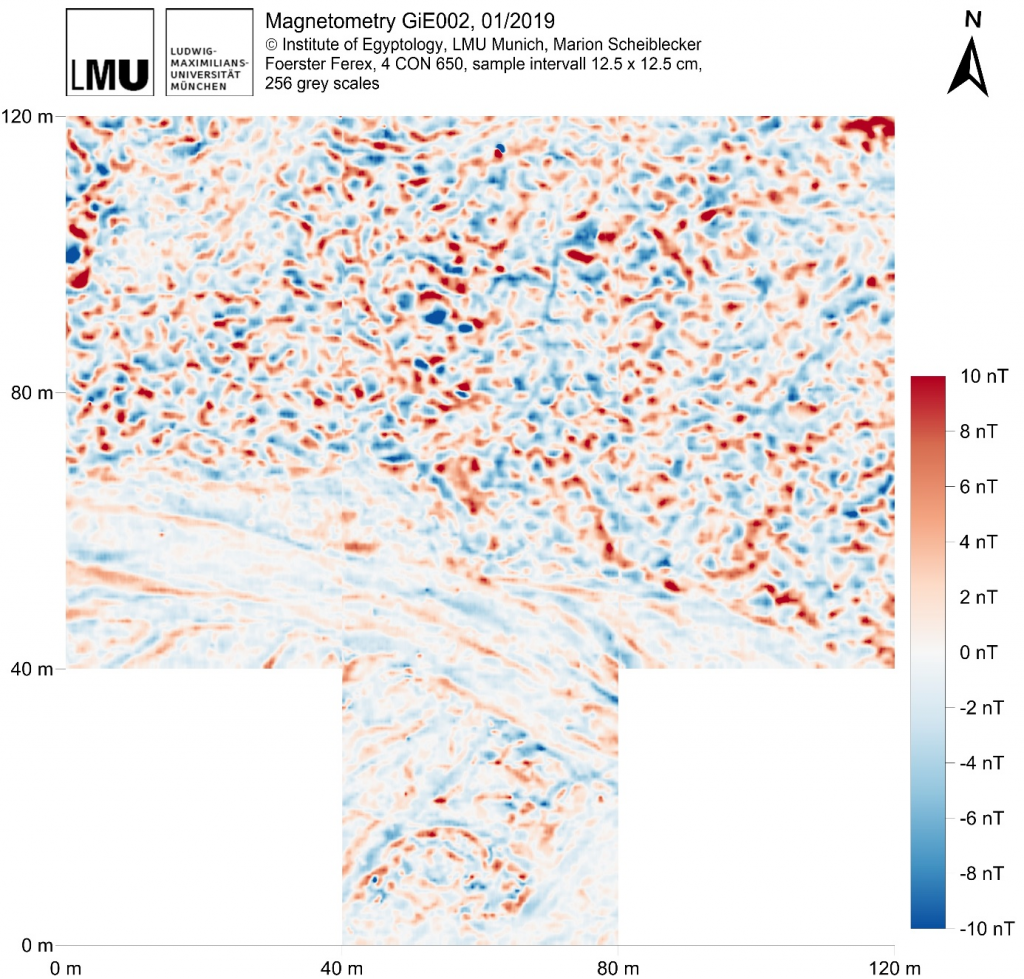
Figure 4: Magnetogram of GiE 002 in blue to red color scale (M. Scheiblecker).
To understand more of the single burials it is helpful to change to a blue-red color scale (Fig. 4). In this way, it is easier to differentiate the single anomalies consisting of the positive (red) and negative (blue) part.
Figure 5: Magnetogram of GiE 002 in highlighted grey scale, showing maximum values in red as well as minimum values in yellow (M. Scheiblecker).
Highlighting the minimum and maximum values – in yellow resp. red – helps e. g. focusing on the probably best-preserved archaeological features located in the center of the measured area, visible in Figure 5.
The magnetograms of GiE 002 show clearly that it is worth playing around with different color scales and that there is more than one magnetogram important for interpreting the data for archaeological and geological purposes.
References
Fassbinder, J. W. E. (2017): Magnetometry for Archaeology. In: Allan S. Gilbert, Paul Goldberg, Vance T. Holliday, Rolfe D. Mandel and Robert Siegmund Sternberg (eds.): Encyclopedia of Geoarchaeology. Dordrecht: Springer Reference (Encyclopedia of Earth Sciences Series), 499-514.
Livermore, P.W.; Finlay, C.C.; Bayliff, M. (2020): Recent north magnetic pole acceleration towards Siberia caused by flux lobe elongation. Nature Geoscience 13, 387–391.
Ostner, S.; Fassbinder, J. W. E.; Parsi, M.; Gerlach, I.; Japp, S. (2019): Magnetic prospection close to the magnetic equator: Case studies in the Tigray plateau of Aksum and Yeha, Ethiopia. In: James Bonsall (ed.): New Global Perspectives on Archaeological Prospection. 13th International Conference on Archaeological Prospection. 28 August – 1 September 2019. Sligo – Ireland. Oxford: Archaeopress, 180-183.
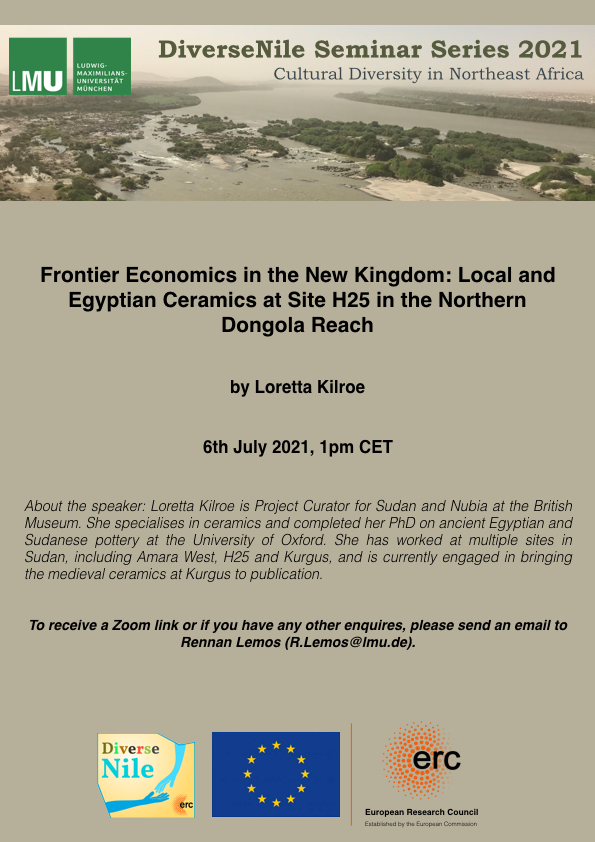
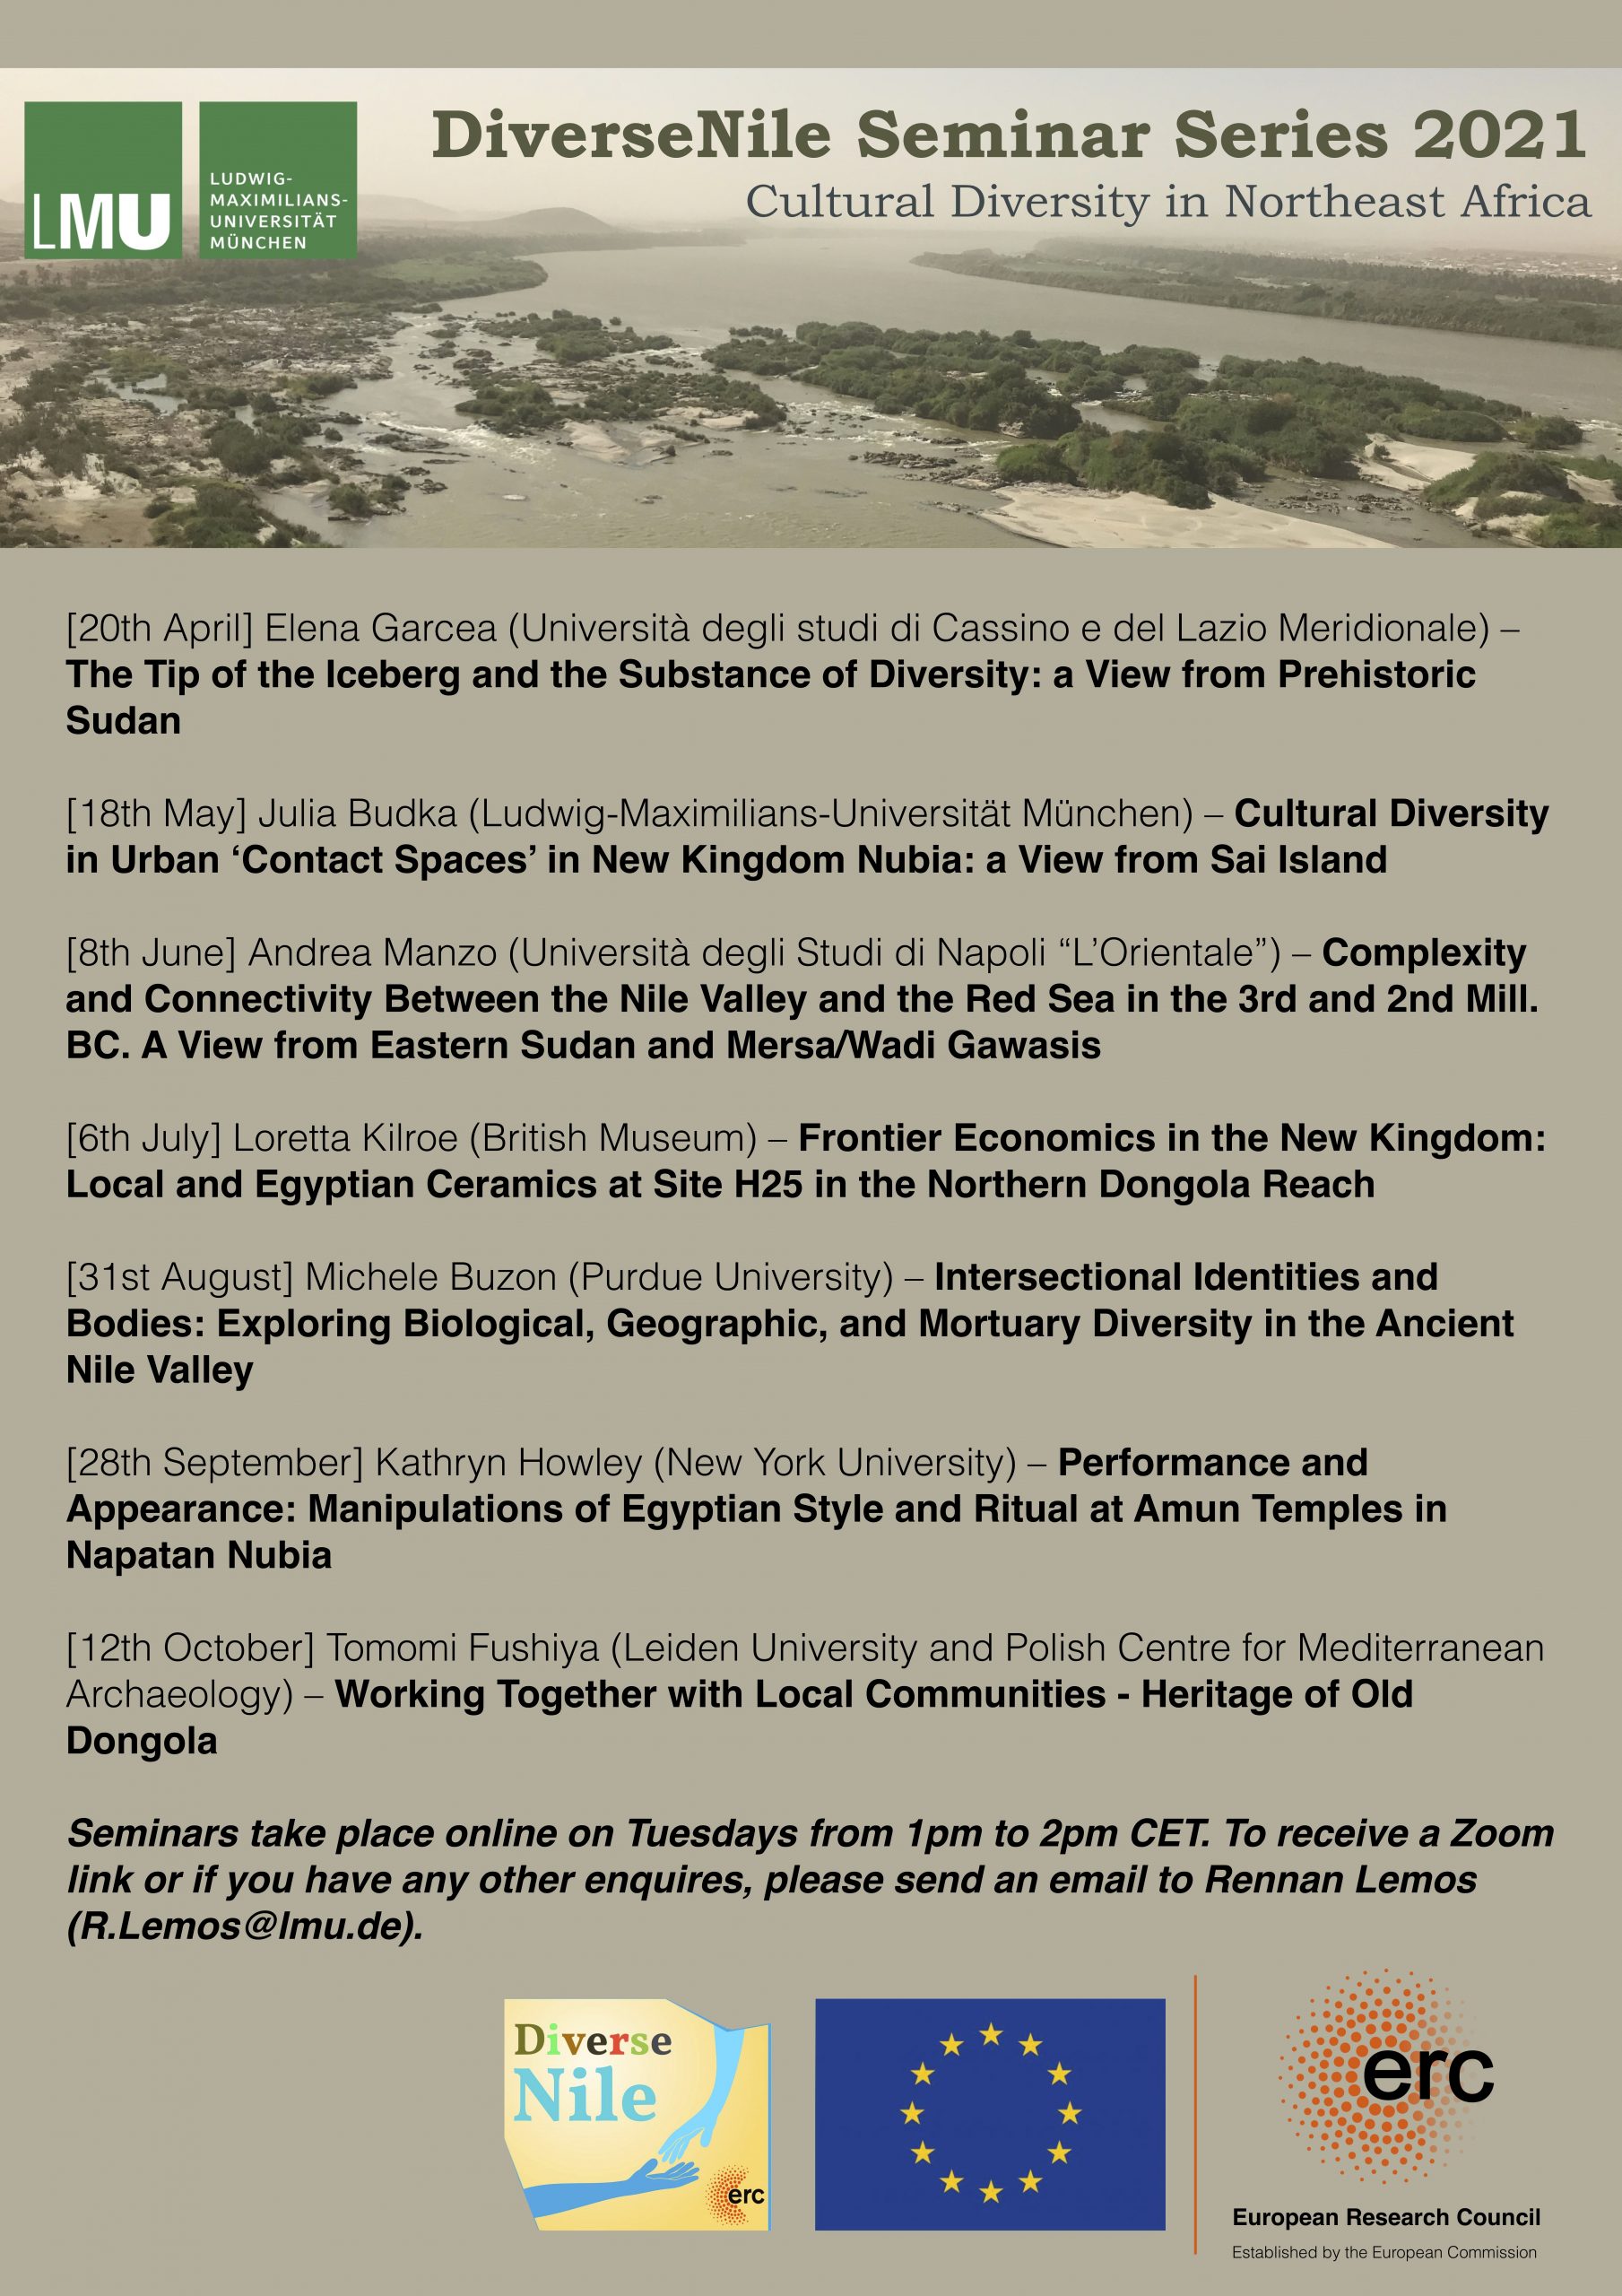
In the framework of the DiverseNile project, I have introduced the application of ‘contact space biographies’ as a new concept in the study of intercultural encounters in the Middle Nile. We will specify the question of cultural encounters through the distribution of the sites and their duration, settlement infrastructures, building techniques, production activities and technologies, trade, diet, material culture, burial customs, religious practices and social structures. The importance of peripheral areas, like the Attab to Ferka region, for our understanding of cultural formations will be stressed. In line with this, the DiverseNile Seminar Series 2021 focuses on cultural diversity in Northeast Africa, giving several case studies from various perspectives.
Our next presentation, to be held tomorrow by Loretta Kilroe, will introduce an exciting example of so-called ‘provincial’ Kerma remains in the Northern Dongola Reach.
Site H25 was partly excavated in the last years and yielded settlement remains and evidence from the Kerma, New Kingdom and Napatan eras (Ross 2014; Porter 2019; Kilroe 2019). The site is, among others, shedding new light onto trade networks in New Kingdom Nubia. Because Loretta is an expert on ancient Egyptian and Sudanese pottery, she will focus tomorrow on ceramics and what they can tell us about frontier economics.
I am personally very much looking forward to this exciting presentation about an as yet little known but very important site! As usual, last minute registrations are still possible and highly welcome!